Homegrown Band Count, 1999 to 2012
“Ten bands, then 25, then 40 and 50. It would be nice to see it plotted out.” — Homegrown Music Festival founder Scott Lunt in today’s Duluth News Tribune
Here it is, plotted out:
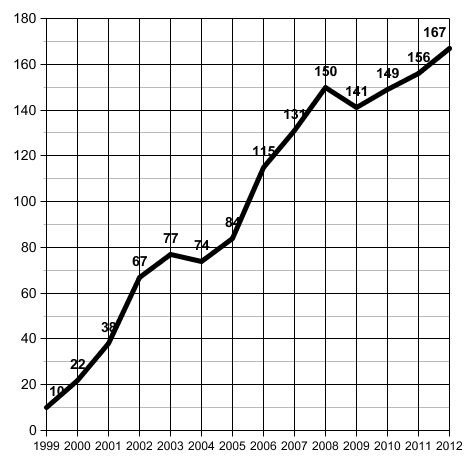


“Ten bands, then 25, then 40 and 50. It would be nice to see it plotted out.” — Homegrown Music Festival founder Scott Lunt in today’s Duluth News Tribune
Here it is, plotted out:
Thank you Paul.
Can I get that plotted out with delineation for reoccurring bands, and bands reoccurring at venues? Thanks!
No problem. Here you go.
[img]https://www.perfectduluthday.com/wp-content/uploads/comments/graph-of-bands.jpg[/img]
Can you send me a .csv or .xlsx because I’m all about the many eyes visualization tool. Like and data you got, I’ll get freaky deaky on it.
Can I get a graph of how many bands had left handed members?
Thanks Paul. Looks like my first year as festival director holds the record for the most year over year growth. In 2006 we added 31 additional bands. Of course that was in large part because that’s the year that we went from 4 to 8 days.
So, looking ahead to 2013 – Dizzo will have to get up to 199 next year to break the record. Go for it!
Need. More. Metrics!
It looks as though the Great Recession of 2008 took a toll on Homegrown, fortunately it looks as though it is on the rebound.
‘MERICA
Now HERE is what I’m talking about. Click on “Experiment” and “Network Graph” …
try this:
Vertex 1 = Venue
Vertex 2 = Band 1
Weight = Location
nodes shown = 102